
E. Conversation Management
Funnel Analytics
See how visitors move from opening the chat to becoming leads. The funnel tracks four stages, split between your widget and share-link surfaces.
Updated 6 Sep 2026
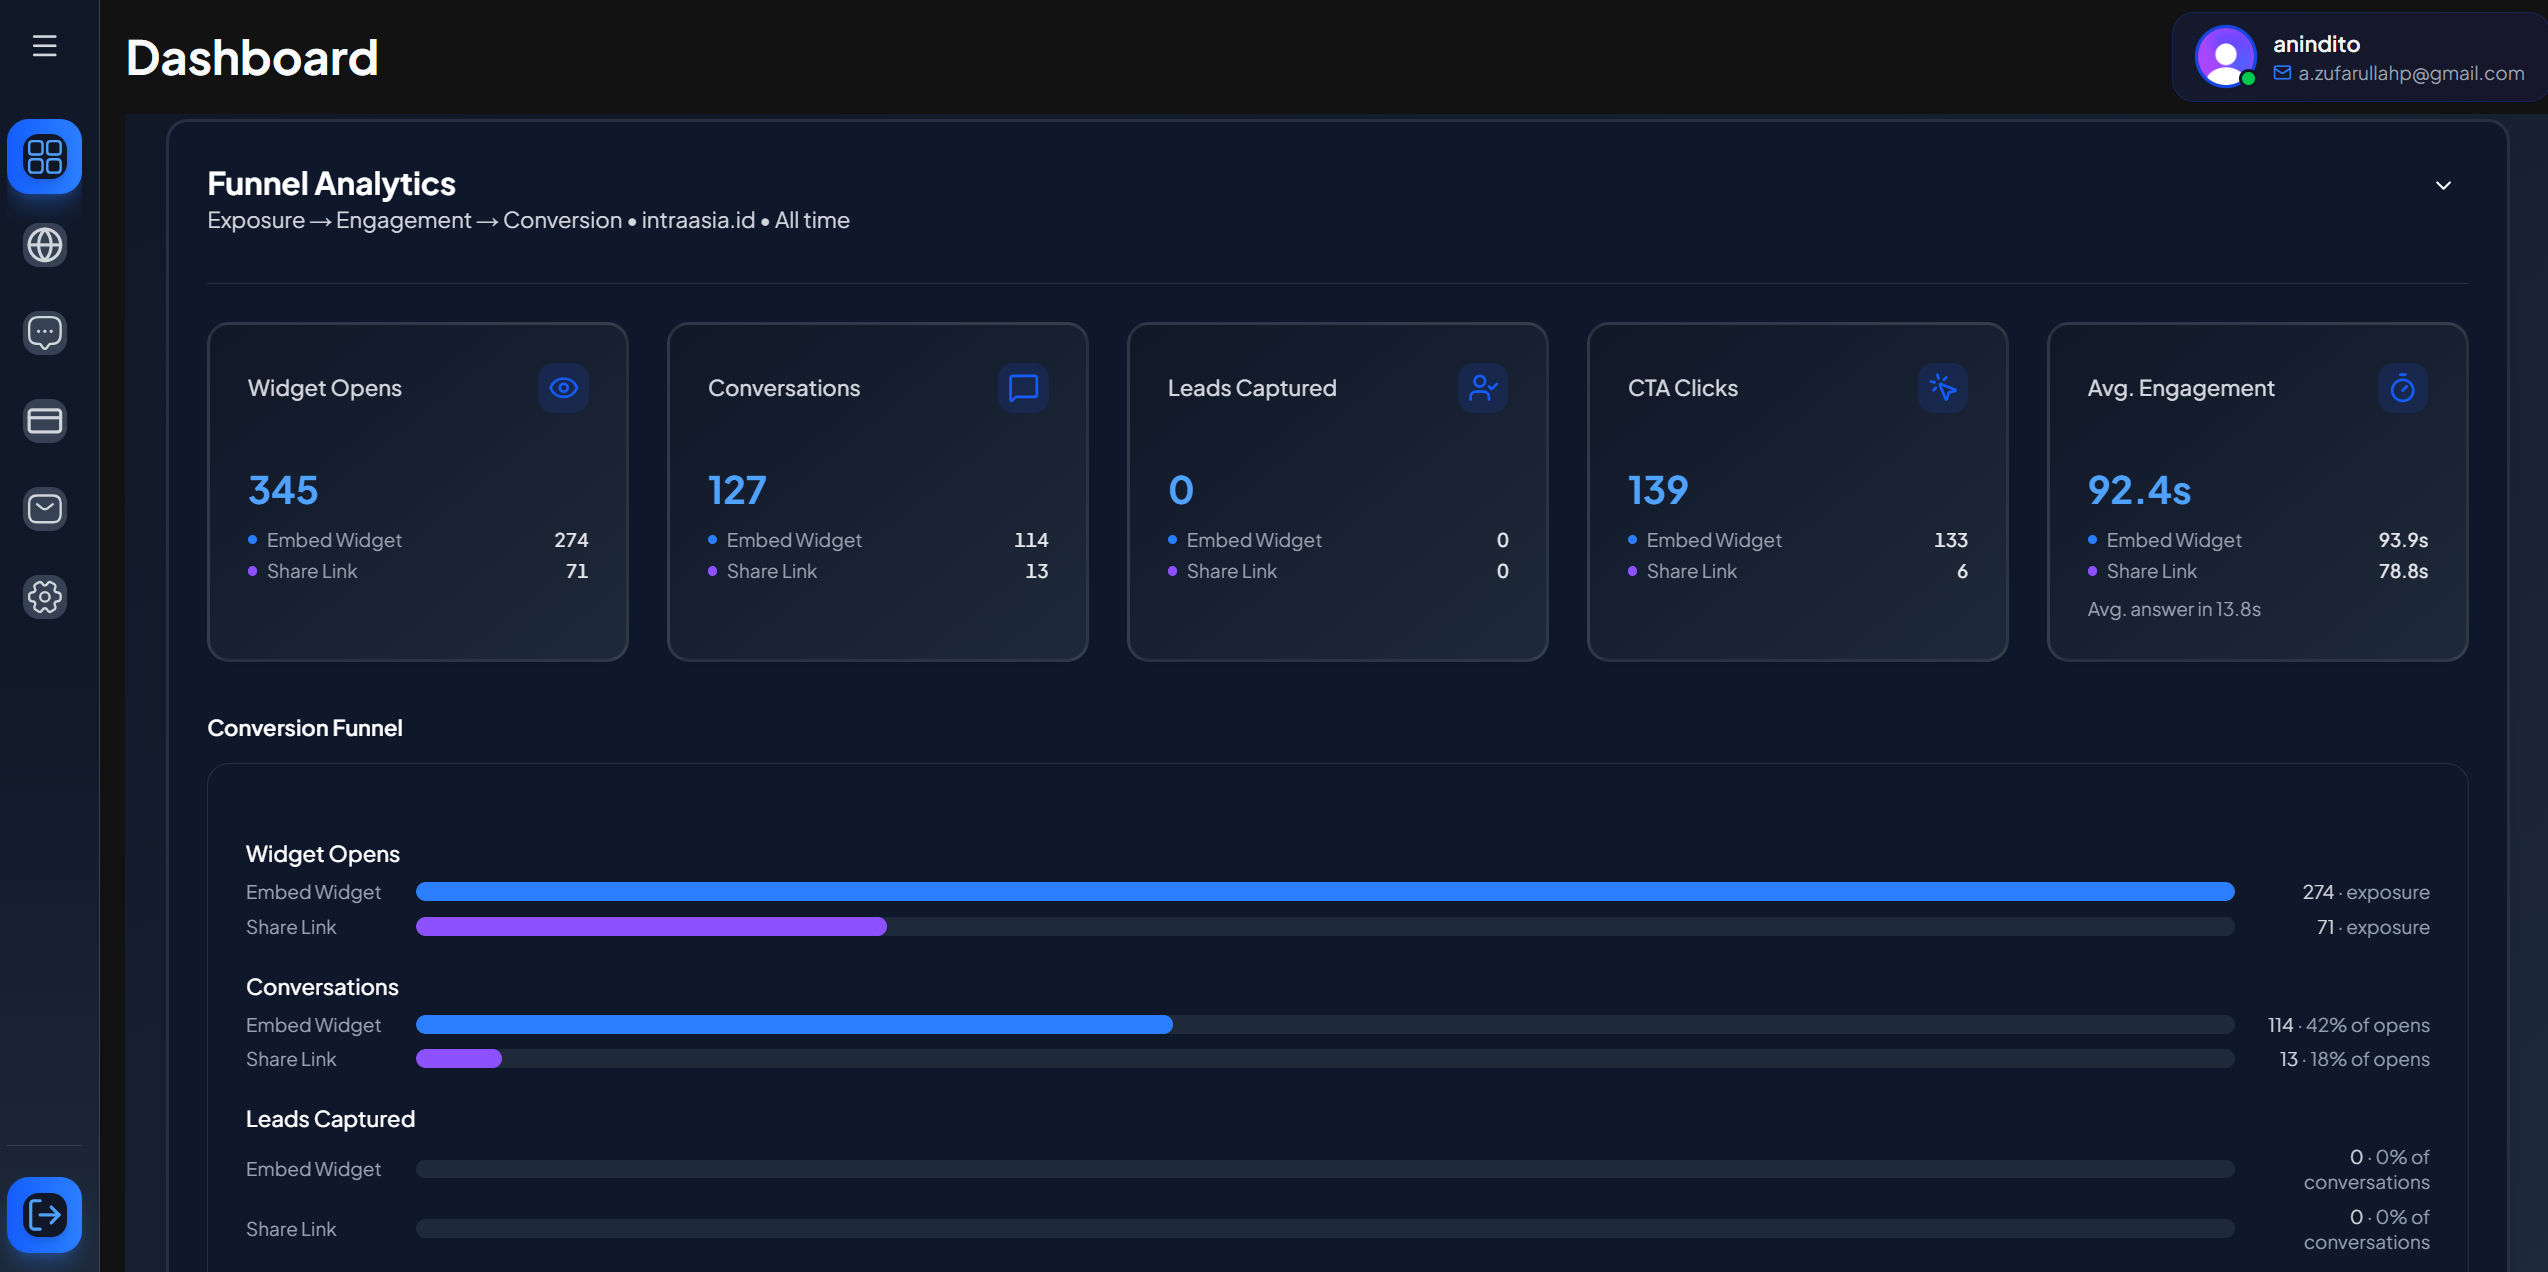
Funnel Analytics shows how visitors move from first contact to a result. It sits on the Dashboard, below the usage cards, and uses the same domain and date-range filters.
The four stages
- Widget Opens. A visitor opened the chat.
- Conversations. A visitor sent a first message.
- Leads Captured. A visitor shared contact details.
- CTA Clicks. A visitor clicked a link or action the assistant offered.
A conversion funnel below the tiles shows how many visitors continue from one stage to the next, and a daily trend shows movement over time.
Split by surface
Every metric is shown separately for two surfaces:
- Embed Widget: the chat on your website.
- Share Link: the conversation page at
privas.ai/c/....
Each surface's rate is measured against its own opens. This split matters: a combined total can hide a surface that is recording nothing. If one surface shows activity and the other is flat, look at that surface on its own rather than reading the total.
Reading the funnel
- A steady rise in conversations means growing visitor engagement.
- A wide drop between opens and conversations means visitors open the chat but do not start; review your greeting and quick messages.
- A drop between conversations and leads means the assistant is answering but not capturing contact details; review your follow-up prompts.
When data appears
The funnel is built from a rollup that refreshes periodically, so a brand-new domain shows an empty state until enough activity is recorded.
Next step
To turn captured leads into follow-up conversations, see Email Follow Ups.