E. Conversation Management
Usage Dashboard
The Usage Dashboard helps you monitor activity across your AI representatives.
By aninditoUpdated 5 Mar 2026
Dashboard menu shows how many conversations are happening, how much usage your assistants consume, and when the most recent visitor activity occurred.
What you can see on the Dashboard
The Dashboard provides a quick overview of usage across your domains:
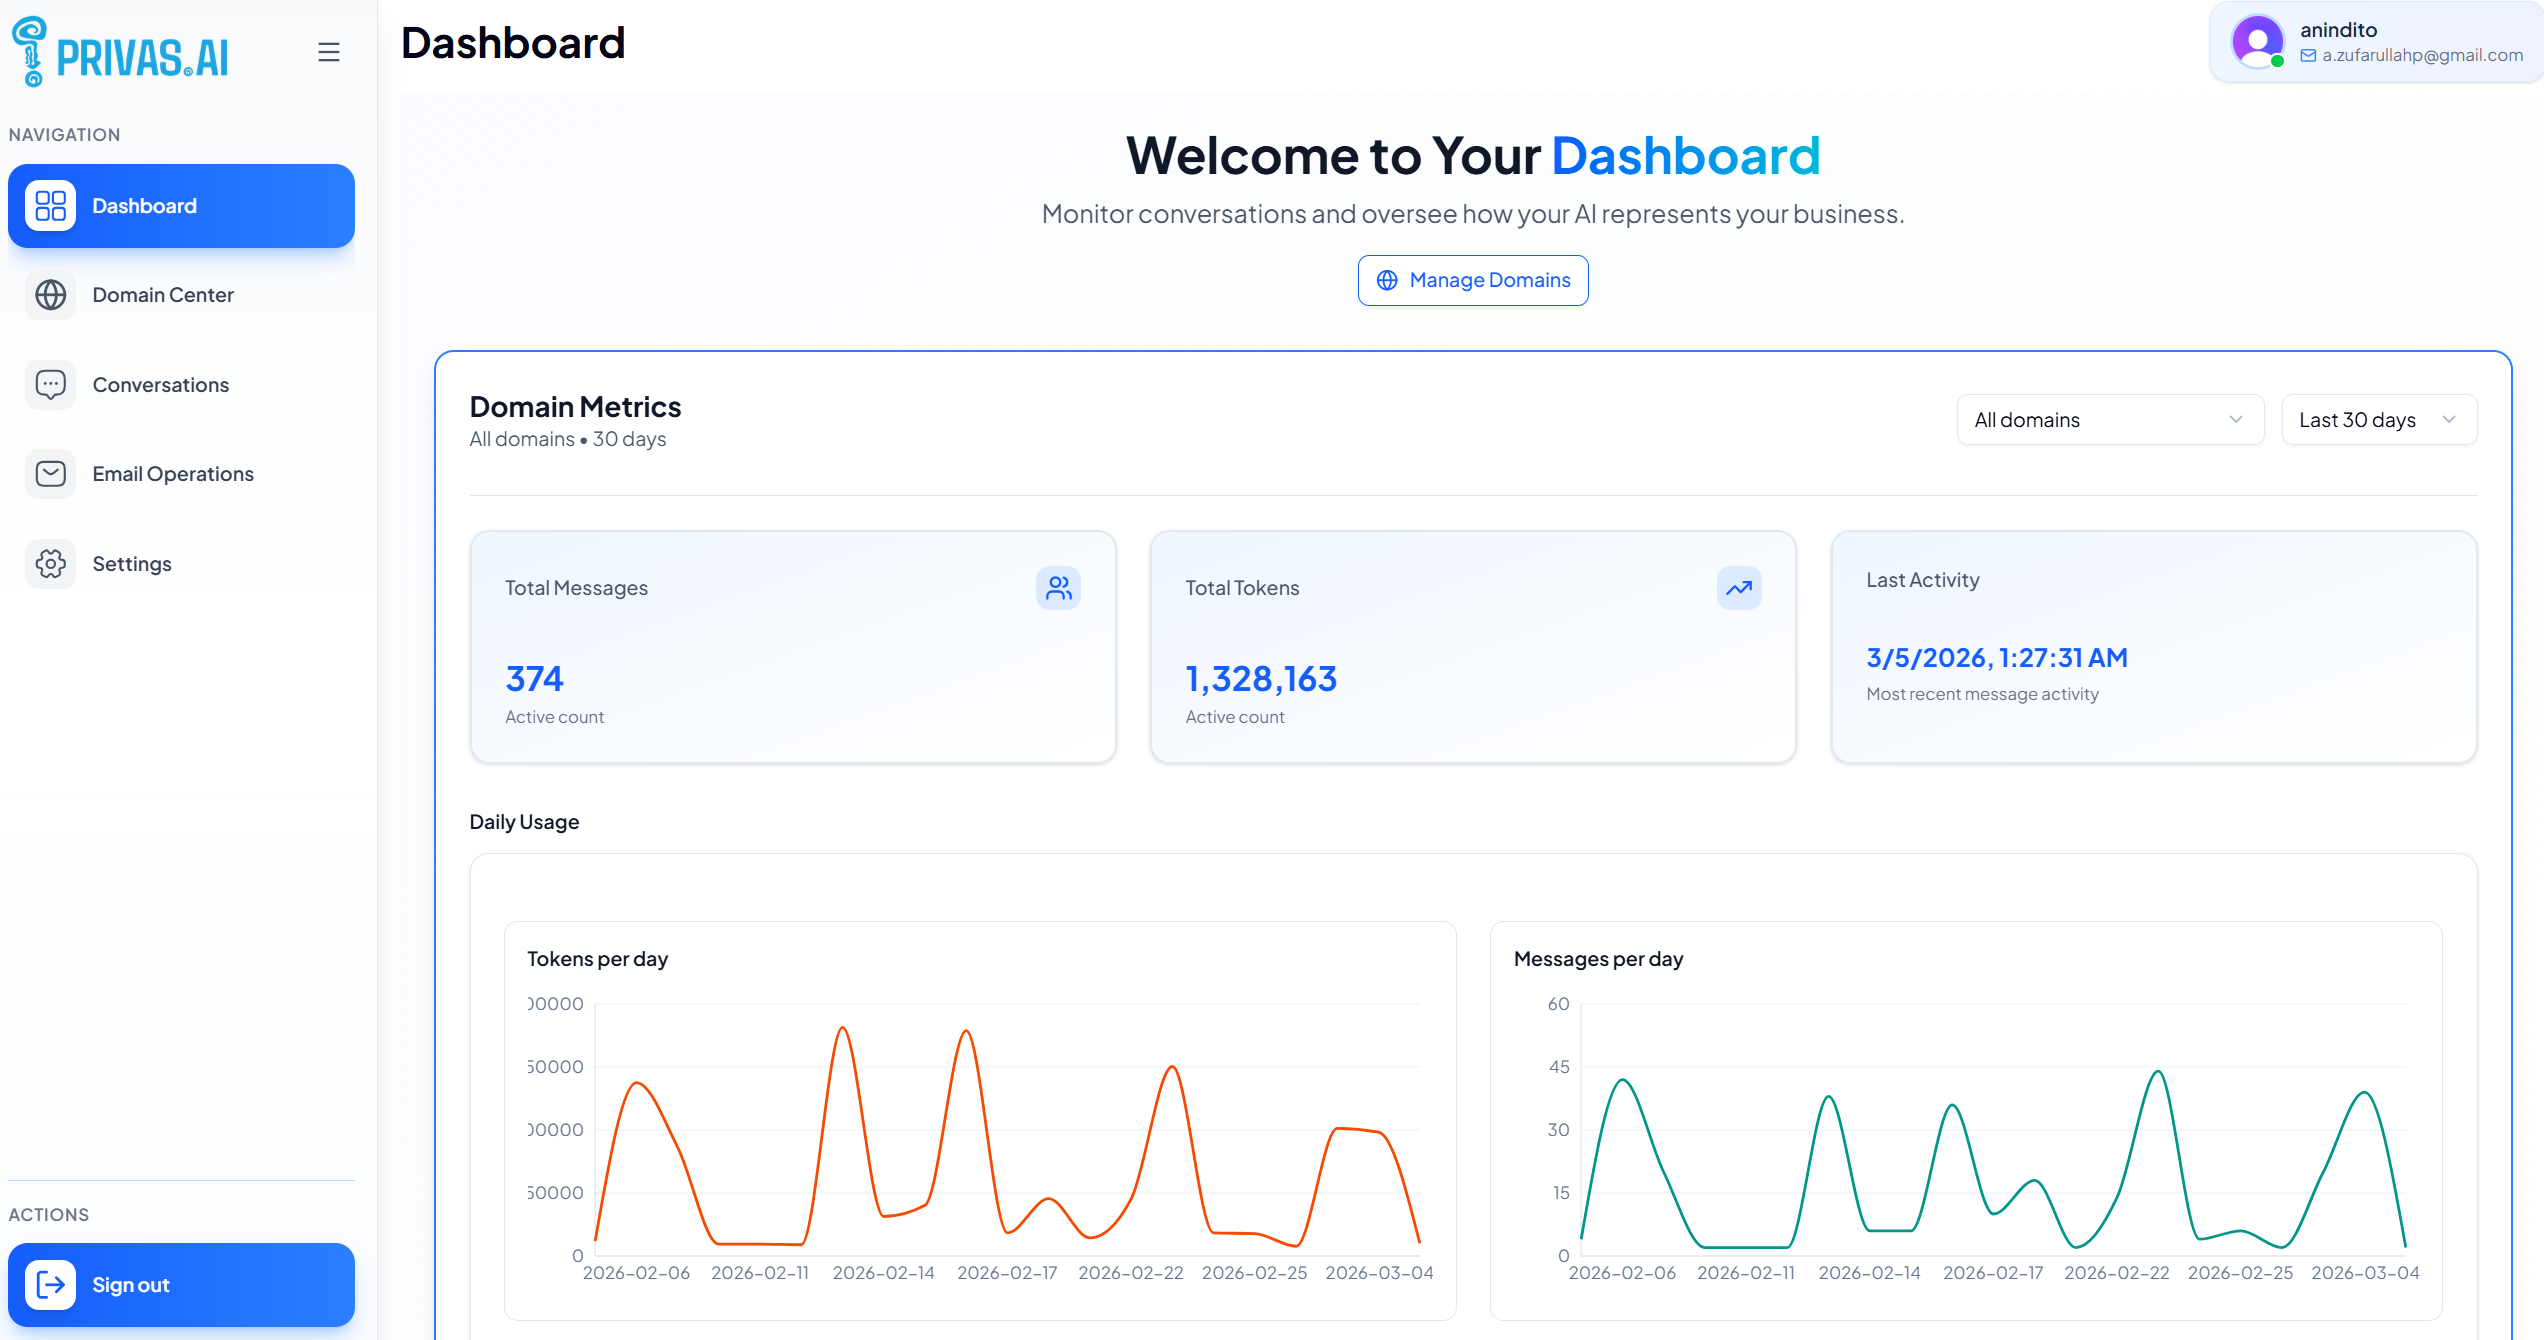
Domain Metrics (summary cards)
-
Total Messages
The total number of chat messages across the selected domains and date range. -
Total Tokens
The total AI usage volume across the selected domains and date range.
(Higher tokens usually means longer conversations or heavier knowledge retrieval.) -
Last Activity
The timestamp of the most recent message activity.
Daily Usage charts
The Dashboard also includes trend charts:
-
Tokens per day
Helps you see AI usage spikes (long conversations, heavy retrieval, or higher traffic days). -
Messages per day
Helps you see visitor engagement trends (how often people chat each day).
These charts are useful for comparing engagement vs. cost/usage.
Step-by-step: How to use the Dashboard
1) Open the Dashboard
From the left navigation, click Dashboard.
You will see Domain Metrics and Daily Usage charts.
2) Filter by domain
In the top-right of the Domain Metrics section, select:
- All domains (default), or
- a specific domain (to focus on one AI representative)
Use this when you want to review adoption per website.
3) Filter by time range
Next to the domain filter, choose a time range such as:
- Last 30 days (default)
Use shorter ranges to investigate recent changes, or longer ranges to evaluate growth.
4) Interpret activity quickly
Use the summary cards for fast checks:
- If Last Activity is recent, the assistant is actively used.
- If Total Messages is growing, your widget is being engaged.
- If Total Tokens spikes without a similar messages spike, conversations may be longer than usual.
5) Use trends for evaluation
Use the charts to understand patterns:
- Steady upward messages trend → increasing visitor adoption
- Spiky token usage → a few long or complex conversations
- Drops to near-zero → widget might not be visible, traffic is low, or the site is in maintenance
Why this matters
Usage metrics help you manage your AI representative like a real website feature:
- confirm visitors are actually using it
- track adoption after you publish the widget
- detect unusual spikes or sudden drops
- decide when to improve knowledge sources or add follow-up options
What’s next
If you want to continue the conversation after a visitor leaves the website, set up:
Email Follow Ups